The main objective of this lab was to gain an understanding of spectral signatures through collecting and analyzing them. To do so, 12 spectral signatures were collected of different surface features and analyzed by creating AOIs with the help of ERDAS 2013 polygon tool.
Methods:
The image used to gather spectral signatures was from 2000 specifically focusing on the Eau Claire and Chippewa Falls area, WI (Figure 1).
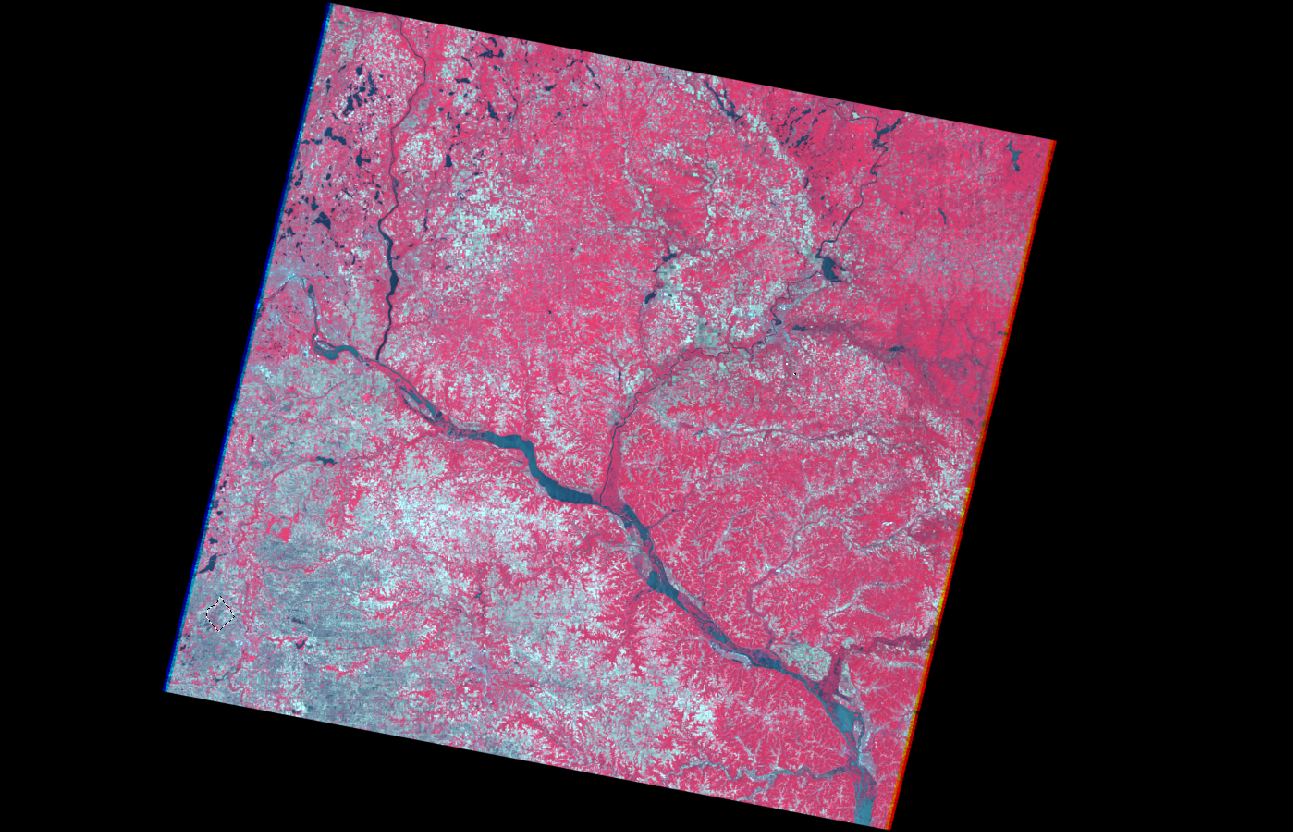 |
| Figure 1 - Study Area |
The 12 surfaces collected included:
1. Standing Water
2. Moving Water
3. Vegetation
4. Riparian Vegetation
5. Crops
6. Urban Grass
7. Dry Soil (uncultivated)
8. Moist Soil (uncultivated)
9. Rock
10. Asphalt Highway
11. Airport Runway
12. Concrete Surface (Parking lot)
Gathering spectral signature data using ERDAS is relatively simple. Under the drawing menu there is a polygon tool. (Figure 2)
 |
| Figure 2 - Polygon Tool icon |
Using the polygon tool, a shape can be drawn on the image, creating an AOI or area of interest. Once the polygon is made, under the raster menu lies "Supervised" (Figure 3).
| Figure 3 - Supervised |
Under "Supervised" select "Create New Signature from AOI" and "Display Mean Plot Window". This adds the signature from the polygon to the new window and display the signature in graph form. (Figure 4)
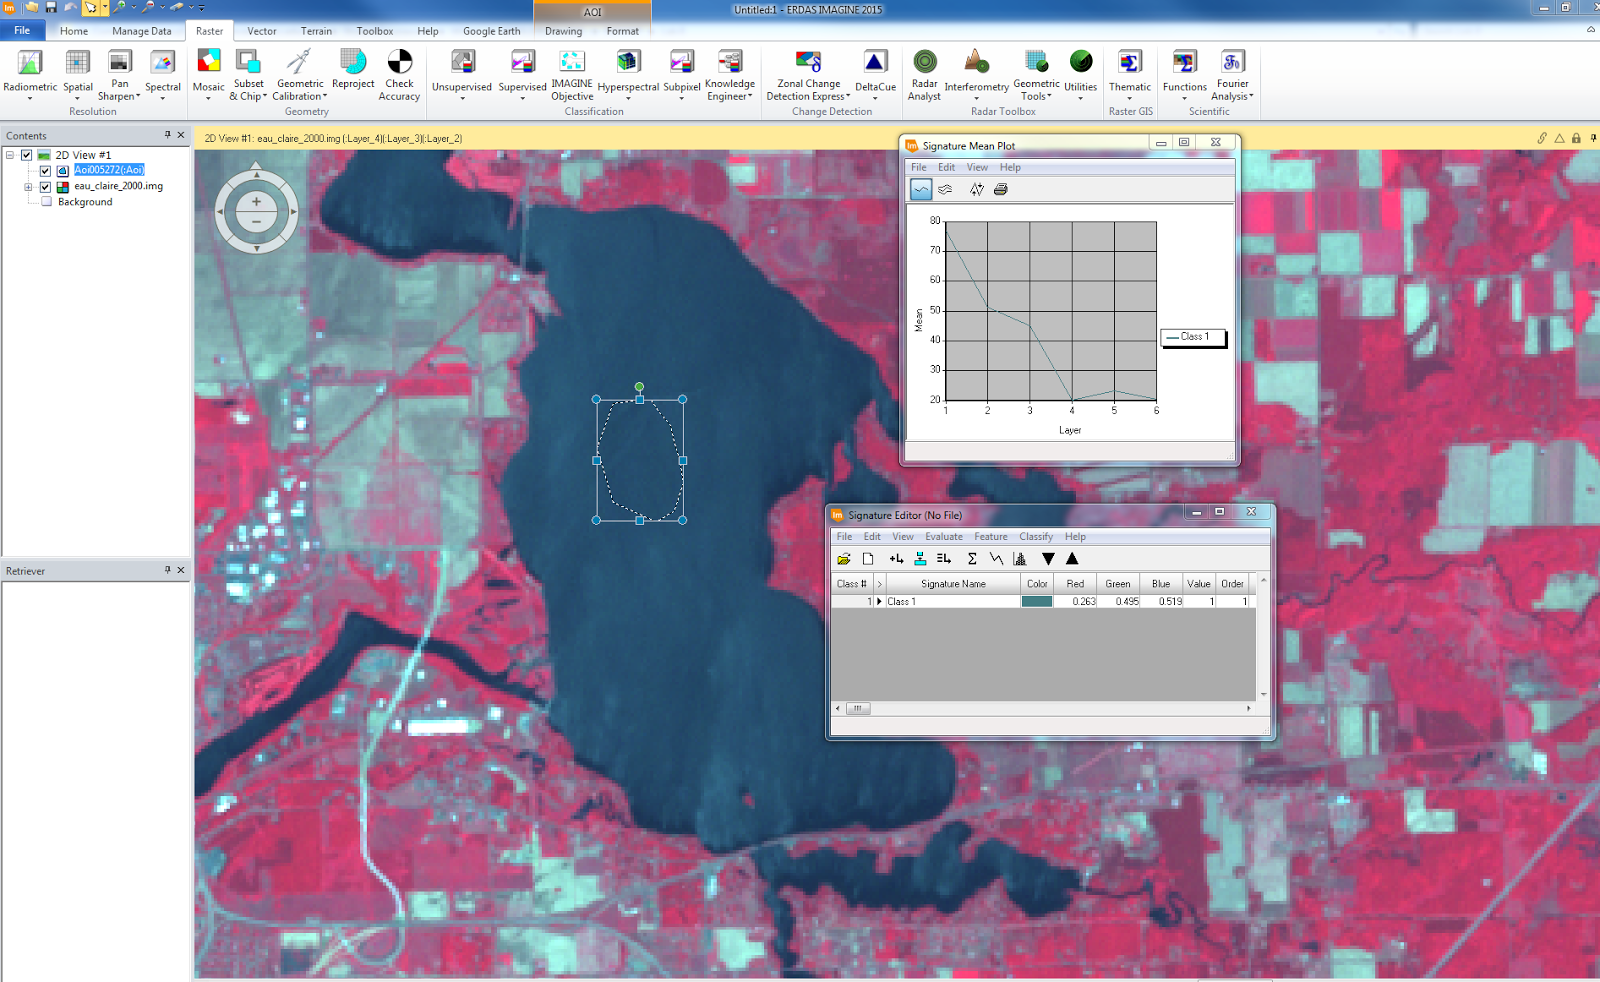 |
| Figure 4 - AOI with Plot |
This step was done for each of the 12 surfaces. Some of the surfaces were hard to distinguish by just using the image from 2000. In that case, a linked Google Earth view was used to verify the surface was in fact the targeted surface. Once each of the 12 surfaces was collected they could be compared using the "Signature Mean Plot". Signatures can be compared on the fly such as soil type signatures (Figure 5).
 |
| Figure 5 - Soil Signatures comapred |
Results:
Looking at all 12 surfaces (Figure 6) we can see a wide variety in spectral signatures. This is due to factors such as moisture content, materials found in the surface, ect.
 |
| Figure 6 - 12 Surface Results |
Sources: Wilson, Cyril. (2015). Geog 338: Remote Sensing of the Environment Lab 8 Spectral Signature Analysis. Personal collection of Cyril Wilson, University of Wisconsin-Eau Claire, Eau Claire, Wisconsin.
No comments:
Post a Comment