With this lab the main focus is learning how to perform photogrammetric correction and manipulation using aerial photographs and also satellite imagery. Before diving in to the software and having ERDAS do the calculations it was import to understand the basic formulas and math behind the correction.
Methods:
As mentioned it is important to understand some basic calculations for measuring data on imagery. The first task was calculating the scale of a near vertical image. There is a number of methods that can be used to do the same task, it all depends on what data is presented and from there picking the method that best fits the scenario is the way to go.
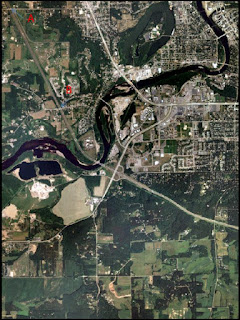
The first method for calculating scale is using an image (Figure 1) and picking two points on the image. The distance between these points can be compared to real world distance and be extrapolated from there. In the case of (Figure 1) the distance between A and B is 2.7 inches. The real world distance from A to B was 8822.47 ft. From there the next step is converting the real world distance to inches. The real world distance in inches is 105896.64. Because A to B on our image is 2.7 inches the fraction would be 2.7/105896.64 = 1/39210. With scale you want to round to the nearest whole number so in this case the scale is 1/40,000.
 |
| Figure 1 - Image with Point A and B |
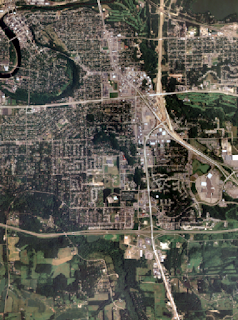
If you don't have the real world distance that doesn't mean you are out of luck it simply means you have to depend on using other methods. If the focal length of the camera is known along with the height the image was taken at it is still possible to calculate the scale. For the purpose of this image (Figure 2) the image was taken at a height of 20,000 ft and the camera it was taken with had a focal length of 152 mm. The ground elevation for the study area was 769ft.With all of this information known the first step is unit conversion. 152mm=.4986816ft. Now that the information is all in the same unit, inputting the information in to the formula Scale=f/H-h. .4986816/(20000-796) = .4986816/19204 = 1/38509. Once again it is important to round so the scale of this image is yet again, 1/40,000.
 |
| Figure 2 - Image used for calculating scale |
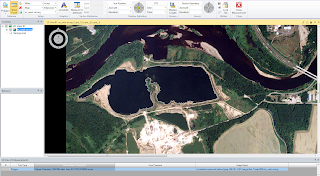
With the help of ERDAS, entire features can be measured on aerial photographs. ERDAS has a feature specifically for this called the Polygon Measurement Tool. This tool allows for users to draw polygons around a feature in order to gather data such as perimeter and area. In this image (Figure 3) a polygon was drawn around the lagoon and ERDAS presented the measurement data below in the measurements window. A number of units can be selected and changed on the fly depending on the unit of measurement needed for the project.
 |
| Figure 3 - Polygon with measurements below |
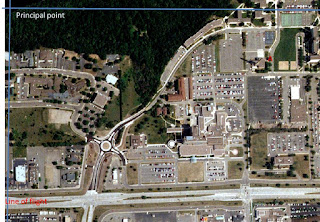
Another aspect to consider when looking and analyzing aerial images is relief displacement. Relief displacement is essentially the variance of an object on an image from its true position on the ground. In (Figure 4) the smokestack featured appears to be leaning and not straight up and down when in actuality the smokestack is perpendicular from the ground. To calculate the displacement the variables needed are real world height, radial distance from principal point to the top of the displaced object and height of the camera. Displacement=h*r/H. The smokestack was 1604.5 inches and the radial dst was 10.5 inches. The camera height was 47760 inches. 1604.5*10.5/47760 = .352748. This means the smokestack needed to be moved .35248 inches to be vertical as it would be if you were at the base looking up at it.
 |
| Figure 4 - Relief Displacement |
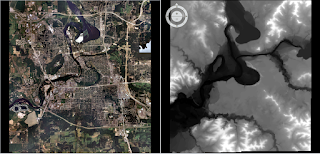
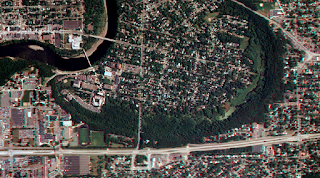
The next concept we touched on was stereoscopy which is using your eyes depth perception to view a 2D image in 3D. A number of tools can be used in ERDAS to accomplish this included the Stereoscope tool, anaglyph tool and with the assistance of red and blue "3D" polaroid glasses. Under the terrain menu in ERDAS the anaglyph tool can be found, after inserting the aerial image and DEM for an area (Figure 5) the tool can be used for creating an anaglyph image in ERDAS (Figure 6). With the assistance of glasses you can see that the elevation differences can be seen in 3D.
 |
| Figure 5 - Aerial Image and DEM |
 |
| Figure 6 - Anaglyph created using Aerial Image and DEM |
The last area of photogrammetry we focused on was orthorectification. Orthorectification is used to removed errors regarding position and elevation from gathering points on various forms of imagery. To do so accurately, not only x and y data has to be found and used but also z or elevation. To orthorectify ERDAS has a tool called Imagine Photogrammetric Suite. This tool can be used for a variety of purposes including orthorectification and triangulation. The goal of this section of the lab was to use a series of images and orthorectify them to create an accurate orthoimage. The images used overlapped but not evenly at the same point and needed to be corrected.
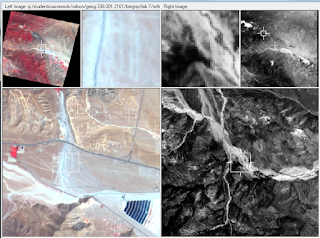
The first step was to open up Image Photogrammetry Project Manager and create a new block file. For this project the Geometric Model Category was set to Polynomial-based Pushbroom and also SPOT Pushbroom. Under Block Proptery Setup the projection was set to UTM - Clarke 1866 and the Datum to NAD 27 - (CONUS). After these settings were selected the first image could be brought in. The next step was to begin collecting GCP's. A reference image was brought in and 9 GCP locations were selected (Figure 7) with some guidance from Dr. Wilson. 2 additional GCPs were gathered from another reference image. After all the GCPs were selected the table contained x and y values but lacked elevation. The z values were filled in using data automatically inputted from the DEM. Once gathering all the x,y and z points were gathered the second image could be added to be corrected. For this to be done the Type and Usage for the control points had to be changed to Full and Control respectively.
 |
| Figure 7 - Adding GCPs |
Using a similar method I was able to add the 11 GCP points from the first image to the second. This was a rather quick process.
Once correlating all 11 GCPs the Automatic Tie Point Generator could be used to calculate and find tie points between the tow images. This was done through a process called block triangulation, for a successful block triangulation at least 9 tie points are required. When setting up the Automatic Tie Point Generator the settings used were Image Used - All Available and Initial Type - Exterior/Header/GCP. The number of points I desired was set to 40. After the tool finished running I inspected the summary and looked at the tie points to verify the tie points found were accurate.
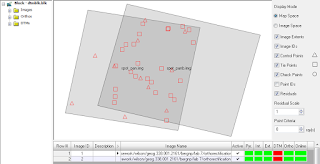
One of the last steps required was running the Triangulation tool. After the tool finished running, a report was created displaying the accuracy levels (Figure 8).
 |
| Figure 8 - Triangulated Images |
The final step was running the Ortho Resampling too. Using the first image and the DEM with the settings selecting Resampling Method - Bilinear Interpolation, along with the second imaged added to tool was ready to be run.
Results:
 |
| Figure 9 - Orthorectified Results |
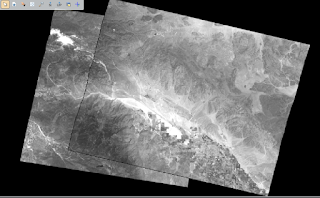
The results above (Figure 9) show a Orthorectified image that is accurately corrected. The only difference between the two images is a slight color change where the images are fused but hardly noticeable.
Source:
Wilson, Cyril. (2015). Geog 338: Remote Sensing of the Environment Lab 7 Photogrammetry.
Cyril Wilson, University of Wisconsin-Eau Claire, Eau Claire, Wisconsin.
ERDAS Imagine
No comments:
Post a Comment